Thursday, June 16, 2011

Enabling IKE and VPN debugging


SOLUTION
Commands used to debug IKE and VPN failures are entered on the Security Gateway involved in the VPN communication. There is no overhead on the Security Gateway due to enabling debugging mode. The Security Gateway does not require a restart or reboot to enable debugging mode. The output is written in a text format to the respective file(s) in the $FWDIR\log directory.

The vpn debug on command activates debugging mode of VPND, the vpn daemon. Debug output will be written to the$FWDIR\log\vpnd.elg file. In order to turn it off, simply type vpn debug off.

The vpn debug ikeon command turns on IKE debugging mode. IKE packets will be written to the $FWDIR\log\ike.elgfile. In order to turn it off, simply type vpn debug ikeoff.

vpn debug trunc empties the ike.elg file, adds a stamp line "...TRUNCATE issued..." and enables both VPN and IKE debugging.

For VSX NGX, VSX NGX R65, VSX NGX R67
  • The vpn -vs <vsid> debug on command activates debugging mode of VPND, the vpn daemon.
  • The vpn -vs <vsid> debug ikeon command turns on IKE debugging mode.
  • vpn -vs <vsid> debug trunc empties the ike.elg file, adds a stamp line "...TRUNCATE issued..." and enables both VPN and IKE debugging.
How to generate a valid ike debug, vpn debug and fw monitor


SOLUTION
It is very helpful to gather the IKE information in both directions by having both endpoints initiate communications at different times so you can see what each machine proposes to the other and then reconcile the differences. Generate debugs for ike and vpnd on both endpoints.

These debugs are valid for VPN connections between SecureClient and Security Gateways, as well as for site to site VPN connections.
Note: This article is also relevant for site to site VPN with 3rd Part Security Gateways.

Follow the steps below to generate debug information:

Note: For SecurePlatform you must be logged in as Expert.

  1. Initiate vpn debug on both Security Gateways from the CLI:

    # vpn debug trunc

    Notes:

    • # vpn debug trunc initiates both vpn debug and ike debug. # vpn debug on only initiates vpn debug.
    • If you need the level of detail provided by TDERROR_ALL_ALL=5, then you need to run: vpn debug on TDERROR_ALL_ALL=5.

  2. Initiate packet capture on both Security Gateways (or tcpdump, or Wireshark pcap):

    Note: You can press "Alt + F1" to open a second terminal, or open a second ssh session, or (for Windows) open a second command prompt.

    # fw monitor -e "accept;" -o monitor.out

    or

    fw monitor -e "accept sport=500 or dport=500;" -o monitor.out

    Note: Since VPN-1 Pro NGX R60, you can also run

    # fw monitor -e "accept port(500) or port(4500);" -o monitor.out

    or

    # vpn debug mon

    If you run # vpn debug mon, the output file is ikemonitor.snoop. In this output file, all the IKE payloads are in clear. Whereas, in monitor.out, all the IKE payloads are encrypted.
  3. Run vpn tu.

    Note: Before running vpn tu, kill all traffic over the VPN.
  4. Then select the option that reads "Delete all IPsec+IKE SAs for a given peer (GW)".
  5. Enter your remote Security Gateway IP address.
  6. Exit the utility.

    Important This procedure closes open VPN tunnels. It may be useful, in that, the next time communication is attempted, you will capture the VPN tunnel creation information. Please be aware that existing VPN tunnels with this remote peer will be closed and will have to be reestablished. This is especially important in a Production environment.
  7. Reproduce the issue, attempt to connect FROM YOUR NETWORK to a device in the remote encryption domain. This initiates the tunnel.
  8. Run vpn tu.

    Note: Before running vpn tu, kill all traffic over the VPN.
  9. Then select the option that reads "Delete all IPsec+IKE SAs for a given peer (GW)".
  10. Enter your remote Security Gateway IP address.
  11. Exit the utility.
  12. Reproduce the issue, attempt to connect FROM THE REMOTE NETWORK to a device in the local encryption domain. This initiates the tunnel.
  13. Stop vpn debug on both Security Gateways:

    # vpn debug off

    # vpn debug ikeoff


    Notes:

    • If you used vpn debug on TDERROR_ALL_ALL=5, you only have to run # vpn debug off.
    • If you run # vpn debug mon, you need to run # vpn debug moff.

  14. Stop packet capture by pressing "CTRL+C".
  15. Please send the following files from the Security Gateways to Check Point Support:
    • $FWDIR/log/ike.elg
    • $FWDIR/log/vpnd.elg
    • monitor.out
    • ikemonitor.snoop.

What information is required to troubleshoot the VPN related issues


SOLUTION
Gather the following information to resolve the VPN related issues:

  1. CPINFO from the Security Management server. Refer to sk30567.
  2. Encryption Integrity, Encryption Strengths, DH group, IPsec lifetime for Phase 1 and 2 and the networks proposed on each end.

    Fill out the following table for each end-point of the tunnel

    1. Check Point Site Info:

    Phase 1

    - Encryption Strength (3Des, Des, AES256) =
    - Encryption Integrity (MD5, SHA1) =
    - Diffie-Hellman Group for IKE (phase 1) (group 1, 2, 5) =
    - Renegotiate IKE (phase 1) (1400 minutes) =
    - Support Aggressive mode (yes, no) =

    Phase 2

    - Encryption Strength (3Des, Des, AES256) =
    - Encryption Integrity (MD5, SHA1) =
    - Use Perfect Forward Secrecy (if yes what group) =
    - Renegotiate IPsec (3600 seconds) =


    2. Are you using Pre-Shared secrets of Certificates?

    3. Are they able to establish the tunnel one-way? If so which way?

    4. What are the address that you are testing from and two in your encryption domains?

    5. What is the IP address and name of the security gateway in question?

    6. What is the IP address and name of the remote VPN site? And type of VPN appliance is it?

    1. Remote Site Info:

    Phase 1

    - Encryption Strength (3Des, Des, AES256) =
    - Encryption Integrity (MD5, SHA1) =
    - Diffie-Hellman Group for IKE (phase 1) (group 1, 2, 5) =
    - Renegotiate IKE (phase 1) (1400 minutes) =
    - Support Aggressive mode (yes, no) =

    Phase 2

    - Encryption Strength (3Des, Des, AES256) =
    - Encryption Integrity (MD5, SHA1) =
    - Use Perfect Forward Secrecy (if yes what group) =
    - Renegotiate IPsec (3600 seconds) =


    2. Are you using Pre-Shared secrets of Certificates?

    3. Are they able to establish the tunnel one-way? If so which way?

    4. What are the address that you are testing from and two in your encryption domains.
  3. The IKE.elg and vpnd.elg files which include an easily identified period when a connection is being tested.
    Follow the below procedure to create the IKE.elg and vpnd.elg debug files:

    1. Delete the $FWDIR/log/IKE.elg and the $FWDIR/log/vpnd.elg files from the security gateway.
    2. On the security gateway run "vpn tu" or "vpn tunnelutil".
      This will bring up the following options:

      (exception in NGX there is an addition option to Delete User with IPsec)


      ********** Select Option **********

      (1) List all IKE SAs

      (2) List all IPsec SAs

      (3) List all IKE SAs for a given peer

      (4) List all IPsec SAs for a given peer

      (5) Delete all IPsec SAs for a given peer

      (6) Delete all IPsec+IKE SAs for a given peer

      (7) Delete all IPsec SAs for ALL peers

      (8) Delete all IPsec+IKE SAs for ALL peers

      (A) Abort

      *******************************************


      Select either option #6 and put in the remote side IP address or select option #8 and delete all the tunnels IPsec and IKE SAs. This will delete the IPsec and IKE SAs and this will send a delete IKE SA packet to the remote side telling it to take down the exciting tunnel.
    3. Run "vpn debug ikeon" to enable the IKE debugging.
    4. From either side of the security gateway generate traffic through the tunnel.
    5. Once the tunnel fails, run "vpn debug ikeoff".
    6. The IKE.elg file will be created in the $FWDIR/log directory on the security gateway.

Troubleshooting Checkpoint VPNS with IKEVIEW

Using IKEVIEW for VPN debugging

IKEVIEW is a Checkpoint Partner tool available for VPN troubleshooting purposes. It is a Windows executable that can be downloaded from Checkpoint.com. Ikeview was originally only available to Checkpoint's CSP partners however they will gladly supply you a copy of thie file if you have a licensed Checkpoint product. This file parses the IKE.elg file located on the firewall.

To use IKEVIEW for VPN troubleshooting do the following:

1. From the firewall type the following:

vpn debug ikeon

This will create the IKE.elg file located in $FWDIR/log


2. Attempt to establish the VPN tunnel. All phases of the connection will be logged to the IKE.elg file.


3. SCP the file to your local desktop.
WINSCP works great

4. Launch IKEVIEW and select File>Open. Browse to the IKE.elg file.


Understanding the IKE.elg output

All Phase I packets will either be labeled Main Mode or Aggressive Mode.

Phase II packets will be labeled QM or Quick Mode.

An arrow pointing to the left (<) indicates IPSEC packets that the Checkpoint firewall (local) receives from the remote Peer. An arrow pointing to the right (>) represent IPSEC packets that the Checkpoint firewall is sending to the remote peer.

Ikeview Phase I Main Mode exchange:

If your encryption fails in Main Mode Packet 1, then you need to check your VPN proposal (encryption/hash/lifetime).


Packet 2 ( MM Packet 2 in the trace ) is from the responder to agree on one encryption and hash algorithm


Packets 3 and 4 aren’t usually used when troubleshooting. They perform key exchanges and include a large number called a NONCE. The NONCE is a set of never before used random numbers sent to the other part, signed and returned to prove the parties identity.


Packets 5 and 6 perform the authentication between the peers. The peers IP address shows in the ID field under MM packet 5. Packet 6 shows that the peer has agreed to the proposal and has authorised the host initiating the key exchange.
If your encryption fails in Main Mode Packet 5, then you need to check the authentication - Certificates or pre-shared secrets

Phase I Main Mode example:

In the example below, we see that Phase I is failing after the first packet (Main mode Phase I takes 6 packets to complete). After the first packet (the initial proposal packet), we see that the remote peer responds with No Proposal Chosen. In this example, the remote peer rejected the local proposal of AES/SHA1 with a lifetime of 86400 seconds and the provided Preshared key.


Phase II Quick Mode exchange:

Next is Phase II - the IPSec Security Associations (SAs) are negotiated, the shared secret key material used for the SA is determined and there is an additional DH exchange. Phase II failures are generally due to a misconfigured VPN domain. Phase II occurs in 3 stages:

1. Peers exchange key material and agree encryption and integrity methods for IPSec.
2. The DH key is combined with the key material to produce the symmetrical IPSec key.
3. Symmetric IPSec keys are generated.


In IkeView under the 
IP address of the peer, expand Quick Mode packet 1:
> "P2 Quick Mode ==>" for outgoing or "P2 Quick Mode <==" for incoming > QM Packet 1

> Security Association

> prop1 PROTO_IPSEC_ESP

> tran1 ESP_AES (for an AES encrypted tunnel)

You should be able to see the SA life Type, Duration, Authentication Alg, Encapsulation Mode and Key length.
If your encryption fails here, it is one of the above Phase II settings that needs to be looked at.

There are two ID feilds in a QM packet. Under

> QM Packet 1

> ID

You should be able to see the initiators VPN Domain configuration including the type (ID_IPV4_ADDR_SUBNET) and data (ID Data field).

Under the second ID field you should be able to see the peers VPN Domain configuration.

Packet 2 from the responder agrees to its own subnet or host ID, encryption and hash algorithm.

Packet 3 completes the IKE negotiation.


Phase II Quick Mode example:

Below is a screenshot of a failed VPN connection for Phase II. From this example, we can see that Phase I(Main Mode) completed successfully. Phase II (Quick Mode) shows a Failed status.

As indicated below, there is an Outgoing proposal (local peer) for AES/SHA1 with a lifetime of 3600 seconds. After the failed Phase II packet, there is an Info packet from the remote peer indicating “Invalid ID Information”. This is an indication that the remote peer rejected our proposal. If the tunnel were being initiated on the Remote End, we would also see the remote peer’s proposal and can compare that to the local proposal.


Common errors indicated in Ikeview

No Proposal Chosen:

A common error that can be easily identified in IKEVIEW is “No Proposal Chosen”.

In the Quick Mode section that is followed by the info line displaying the “No Proposal Chosen” message should display the network mask used for the VPN handshake. Compare the mask used in the local encryption domain with the mask sent by the remote peer. This is a common error when establishing tunnels with non-Checkpoint firewalls. Checkpoint, by default, supernets networks contained in the encryption domain. The method for resolving this issue on the Checkpoint firewall differs depending on if the firewall is R55, R61 simple mode, or R61 classic mode. In R55 there is an option in the VPN section of the Interoperable firewall object that tells the Firewall for “One tunnel per pair of hosts, or one tunnel per pair of subnets”. In R61 Simple mode, there is an option in the VPN Community that says “exchange key per host”. In R61 Classic mode you will need to do the following during non-business hours:

CP Stop

Modify the $FWDIR/lib/user.def.

Change the parameter "IKE_largest_possible_subnet" from true to "false".

CP start.


Aggressive Mode failure:

Aggressive mode uses 3 packets instead of 6 during the Phase I negotiations. Therefore if 1 side of the tunnel is configured for Aggressive Mode and the other side is configured for Main Mode, the 2 peers will not agree with the contents of the first packet during the exchange. If the local peer is mistakenly configured to use Aggressive Mode (which is a less secure method), the outgoing packet will be labeled Aggressive Mode.


Invalid ID-Information:
 

This is an indication that the remote peer rejected either the Phase I or Phase II proposal from the local peer.


PROTO_IPCOMP in the QM packet

This is an indication that IP Compression is enabled for this tunnel.

Viewing and analyzing a CPInfo output file in InfoView


Overview

The InfoView utility lets you view and analyze a CPinfo output file collected from a Check Point server.
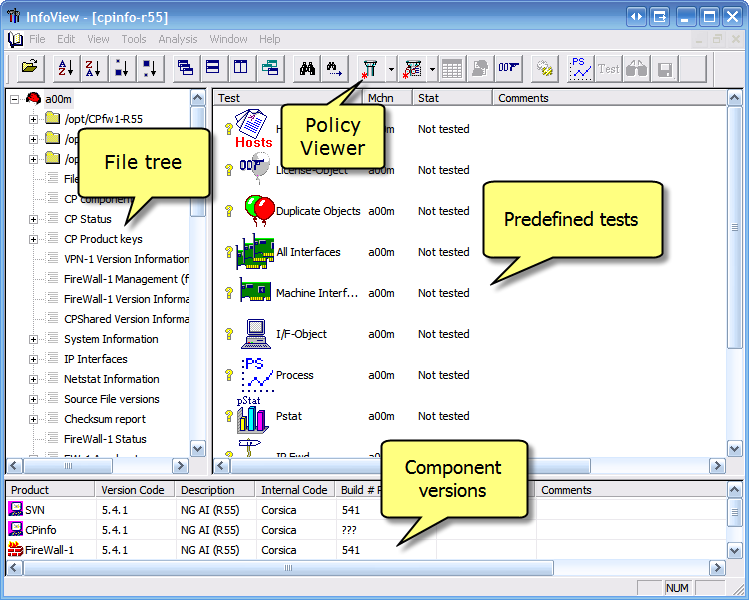
InfoView
  • The left pane shows the data tree, which holds a hierarchical list of input data, consisting of file and directories, in addition to other text sections.
  • The right pane shows a list of tests that can be applied on the input files.

Basic actions

View file/text section
There are 3 ways to open a text file or a text section:
  • Double-click the text file/section.
  • Right-click the text file/section and select 'Open'.
  • Drag and drop the text file/section into an open window of any text editing software (e.g., Notepad, Word).
Note: With the first 2 options, the file will open in your operating system's default text editing program. You canconfigure InfoView to use a specific text editor instead.
Copy file/text section/folder
You can copy a text file, text section, or folder to any Windows folder directly from InfoView. To do this, either drag and drop the file/folder, or copy and paste it.
View the Policy in the Policy Viewer (SmartDashboard)
To better understand the gateway's set-up, and especially the policies, InfoView lets you view the CPInfo information in SmartDashboard on your desktop.
Note: This is possible only if the CPInfo output file is from a management server (i.e., Security Management/SmartCenter/Provider-1/Standalone).
  1. Make sure you have the corresponding customer version of SmartConsole installed.
  2. In InfoView, click the Policy Viewer button (see in above picture), or select 'Tools' > 'Policy' from the main menu. It might take a few minutes for SmartDashboard to show. If required, manually configure the location of different SmartDashboard versions in InfoView - select 'View' > 'Options', go to the 'Directories' tab.

Viewers

Info TabInfo Tab - Kernel table viewer
IKEViewIKEView
LicViewLicView - Check Point License string viewer
Process ViewerProcess Viewer

Advanced actions

Tree sorting
There are 2 sorting options for the data tree:
  • Sort alphabetically - Alphabetically.
  • Sort by size - By file size.
Tree searching
To search for text in the data tree, either click the 'Find' button on the main toolbar, or use the keyboard shortcut Ctrl+F.
Click the 'Find next' button, or press F3 to repeat the previous search.
Export Object File
You can remove all certificate keys from the object file (objects_5_0.C) that is imbedded in the input file. To do this, from the main menu, select 'File' > 'Export object file (fresh CA)' and save the new file.

Analysis pane

The right pane of InfoView is dedicated to analysis. Here you can see a list of tests that you can run on the input file, as well as the status and results of the tests.
To run a test, either double-click it, or select it and press the 'Test' button.
To see the test results after it has finished running, either double-click it, or select it and press the 'View' button.
Possible test statuses:
OKTest Passed
SuspiciousPossible problem (test this issue manually)
IrrelevantThis test is irrelevant to the given input file
Not TestedThis test has not been executed yet

Icon legend

Text section
Text file
Text file (Unavailable - not collected)
Text file (Soft Link)
Text file (Registry)
Text File (WinMSD)
Folder
Root Icon - Firewall is installed
Root Icon - Meta IP is installed
Root Icon - Provider-1 is installed
Root Icon - SecureClient is installed

Data tree

Server Information
To see the server information, right-click the server name (the root of the tree) and select 'Properties'.
Here you can see the server version, if the server is a Security Gateway or Security Management and more.
$FWDIR directory
The tree shows the $FWDIR directory collected by the CPInfo utility from the server. Here you can find some useful files, such as:
  • In the conf directory:
    • objects_5_0.C - Full database objects file.
    • fwauth.NDB - All users the administrator defined on the SmartDashboard.
    • fwauthd.conf - Configuration file of the Security Servers.
    • asm.C - IPS configuration file.
    • classes.C - Definitions of the fields in the CP Database files.
  • In the log directory:
    • fwd.elg - fwd process log file. In the output file, you can find any messages that may have occurred on or about the time a problem was identified. Dates are associated with messages in the file.
    • fwm.elg - fwm process log file.
  • In the database directory, you can see all of the relevant policy files for the Security Gateway.
$CPDIR directory
The tree shows the $CPDIR directory collected by the CPInfo utility from the server.
Here you can find some useful files, such as:
  • In the log directory:
    • cpd.elg - CPD log file. Shows useful information about SIC related issues, CP WatchDog log files (cpwd.elg), processes crashes and more.
  • In the registry directory:
    • HKLM_registry.data - Shows all products and fixes installed on the system.
Other items on the data tree:
  • CP components - Shows overview information about the products installed on the system (such as Acceleration [PPACK], Advanced routing [ADVR], etc.). Might be useful for comparing cluster members.
  • CP Status - Shows policy name and install time, FW connections and packet statistics (per interface as well).
  • FireWall-1 Version Information - Shows the FW & OS patch level including HFAs.
  • System Information:
    • date - Date and time on the machine when the CPInfo was collected (useful for sync issues and logs referral).
    • ethtool <IF name> - Interface configuration and status.
    • ethtool -i <IF name> - Interface driver version.
    • uname -a - OS information, date of OS kernel compilation.
    • uptime - When the system was last rebooted.
    • ps auxww - Processes list (CPU/Memory consumption, PID, full process path).
    • vmstat 1 10 - Machine CPU consumption. User/Kernel space (us=user space, sy=kernel space, id=idle cpu).
    • top -n 2 - System resources usage. Overview: system (kernel), user, softirq (CPU software interrupts), iowait (HD operation), memory usage status, and processes list (as in ps auxww).
    • env - Environment variables.
    • df -k - Hard disk space information.
    • Package Manager Report (RPM) - Output of rpm -qa command. List of RPMs installed.
    • List PCI devices (lspci -nv) - list of hardware devices. Class 0200 stands for Interface Card (NIC). Class and Subsystem information will assist you to identify the exact NIC model in the PCI IDs list . See theHardware Compatibility List to make sure the NIC is supported.
    • Interrupts Information (/proc/interrupts) - Hardware device per IRQ list.
    • Memory Information (free -k -t) - Free memory available. Calculated as explained in sk32206.
    • Loaded Modules (lsmod) - List of kernel modules currently loaded (FW, VPN, acceleration kernel modules, interface drivers, etc).
    • Additional Memory Information (meminfo) - Output of cat /proc/meminfo. for additional memory details such as 'HighTotal' > high kernel memory allocated by the OS during reboot.
    • Additional CPU Information (cpuinfo) - Output of cat /proc/cpuinfo. Specifies the CPU vendor and model, and number of processors.
    • System's Hardware - Server vendor and model details, bios details.
  • IP Interfaces:
    • ifconfig -a - Full details about the interfaces: MAC, MTU, IP, Mask, etc. Can assist in identifying the master in a VRRP cluster (only the master has 'vrrpmac' addresses in this output.
    • fw ctl iflist - Interfaces mapping to the IDs given by the OS during boot. In the kernel debug's output, the interfaces are identified with those IDs, instead of the interfaces' names.
    • fw getifs - Summary display of IP addresses per interface.
  • Netstat Information:
    • netstat -rnv - Full routing table (for routing/advanced routing troubleshooting, cluster members comparison).
    • netstat -i - Interface packets statistics, RX/TX drops and errors per interface.
    • netstat -s - OS statistics per protocol (ICMP, IP, UDP, TCP).
    • netstat -nap - List of open (listening) ports per process, and established connections per process (helps to identify which process is occupying each port at the time the CPInfo was collected).
    • arp -a - ARP table output. Use the MAC addresses to crossover information with traffic captures. If the word "Incomplete" is shown in the output file, it may be an indication that automatic ARP is not working.
  • FW-1 Accelerator - Acceleration device (SecureXL/PPACK) status, build, statistics, accelerated connections and SIM affinity information. "accel packets"/"F2F packets" ratio will give you indication regarding acceleration efficiency. SIM affinity customization can increase performance as well - see sk33506.
  • FireWall-1 Tables - Short Format - Output of fwtab -t <table> -s, list of all kernel tables (connections table ['connections' / ID 8158], NAT table ['fwx_alloc' / ID 8187], etc) and current value of each table (#VALS column).
  • FireWall-1 Statistics (fw ctl pstat) - The last parameter in the output file is State Sync (used for Cluster troubleshooting). It show 'off' when it is off, and shows packets statistics when it is on.
  • FireWall-1 Debug (fw ctl debug) - Shows which kernel debug flags are on.
  • FireWall-1 Chain/Connections Modules - Output of 'fw ctl chain/connections', list of loaded FW chains (corresponds with installed products). Must be identical between cluster members.
  • Overlapping Encryption Domains - Might cause VPN related issues.
  • High Availability - Clustering-related information
    • High Availability State (cphaprob state) - Indicates the cluster mode, the status of the cluster member itself and how this cluster member perceives the status of other cluster members. View and compare statuses of each cluster member.
    • High Availability -i list (cphaprob -i list) - View a Pnote "device" that may be in a problem state. Cluster member status is 'down' when a Pnote is in 'Problem' state.
    • High Availability interfaces (cphaprob -a if) - This output file shows the status of the interfaces for that cluster and VIP addresses, and CCP mode of the interfaces. The number of "Required interfaces" (determined during boot) and the CCP mode (multicast/broadcast) must be the same on both members.
    • High Availability SyncStat (cphaprob syncstat) - Synchronization statistics - refer to Cluster Admin Guide for output analysis in order to tell if there is a sync related problem.
  • VSX Information (CTX 0) [on a VSX machine] - Contains information about the CTX IDs (VS IDs), status and policy details of the VSX physical box and of the Virtual Devices.
  • CP License - Output of cplic print, license information. Using the wrong license might cause unexpected behavior.
  • CPWD (Watch Dog) information - Output of cpwd_admin list, list of all processes monitored by CP Watchdog and their status.
  • DLL_EXEC_Kernel versions - Current builds of system files. You can use this information to check the current builds and to verify if provided Hotfix replaced the files it should.
    • DLL versions - Current build of library files ($FWDIR/lib).
    • EXEC versions - Current build of binary files ($FWDIR/bin).
    • Kernel versions - Current build of kernel modules files ($FWDIR/boot/modules).
  • /var/log/messages:
    • When no buffer is defined in kernel, system messages are sent directly to the OS.
    • We refer to these as "console messages" since in most OSs the messages are printed to the console and copied to /var/log/messages or /var/adm/messages.
    • This is why error messages (which are generated out of debugging context) are sent to the console.
    • When generated in debugging context, error messages are not directed to the console but to the debug buffer, together with all other messages.
    • In Windows, "console messages" in fact appear in the event viewer.
  • /var/log/routing_messages - Advanced routing error messages, search for errors when troubleshooting dynamic routing (GateD) related issues.
  • /etc/resolv.conf - DNS configuration file.
  • /etc/hosts - IP address per hostname mapping. In a cluster environment, misconfiguration of this file might cause unexpected behavior. See sk42952.
  • /etc/sysconfig/ethtab - Interface name per MAC address, OS mapping.
  • /etc/sysconfig/netconf.C - OS interfaces and routing configuration file. Compare it to /etc\sysconfig/ethtab when troubleshooting IP/MAC address mismatches.

Disabling SmartMap before launching the Policy Viewer

SmartMap can make SmartDashboard crash or hang for a long time before SmartDashboard launches from InfoView.
To disable SmartMap:
  1. Open the CPInfo file in a text editor.
  2. Find and replace all instances of:totally_disable_VPE (false)
    Tototally_disable_VPE (true)
    (The value is defined in the object_5_0.C file).
  3. Save a copy of the edited CPInfo file.
  4. Re-open it in InfoView.

InfoView for Provider-1 (pInfoView)

Use the pInfoView tool to view a CPInfo output file collected from a Provider-1 server (MDS level).
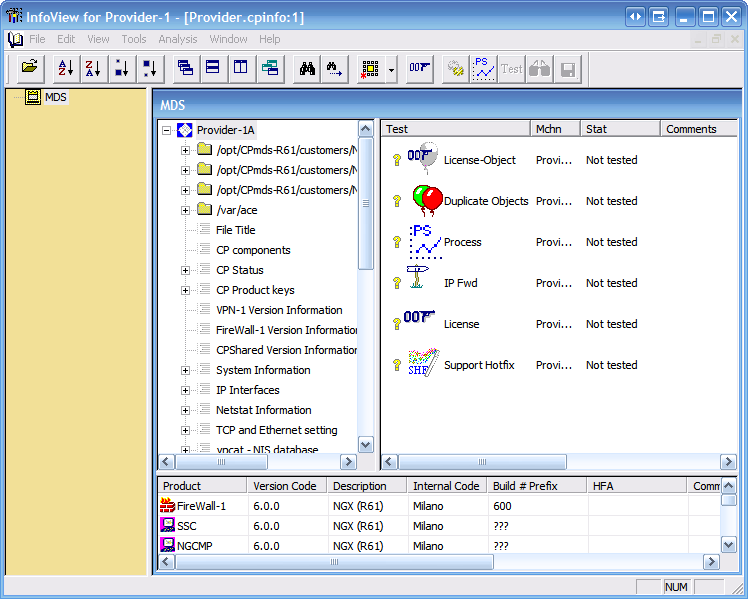
pInfoView
  • The Left pane shows a list of all of the CMAs, arranged under the MDS. The grayed out CMA icons represent CMAs that were not collected by the CPInfo utility.
  • The consists of two sub-panes:
    • The left sub-pane shows the data tree, which holds a hierarchical list of input data, consisting of file and directories, in addition to other text sections.
    • The right sub-pane shows a list of tests that can be applied on the selected MDS/CMA.
Icon legend
In addition to the icons that are listed above, pInfoView includes these 3 icons:
MDSMDS - Selecting this icon changes the context of the right pane to MDS
CMACMA - Selecting this icon changes the context of the right pane to this CMA
CMA (Unavailable)CMA (Unavailable)

Configuring InfoView to use a specific text editor

Procedure:
  1. Open InfoView.
  2. From the main menu, select 'View' > 'Options'.
  3. Under 'File Editor', select 'user defined'.
  4. Click 'Browse' and select your preferred text editor.
  5. Click 'OK'.
Download the InfoView package.For more information about CPInfo, see these Solutions: